Business Analysis: Overview
The Business Analysis metrics within GymOS take two forms. This knowledge base documents the standard form.
An alternate form, developed in partnership with the Gym Owner Network and containing additional proprietary functionality available only to members of the Gym Owner Network, is delivered under the name “Source of Truth”. For guidance on using the Source of Truth variants, consult the documentation area within the secure Gym Owner Network site.
The Business Analysis Overview is accessed from within the Reporting section of the main navigational menu. For Gym Owner Network members, this called Source of Truth and appears at the top of the main menu.

Before you can access the Business Analysis functions, you must configure your tracker settings. Once this has been completed and the initial data population has finished, the GymOS business analysis functions will become available.
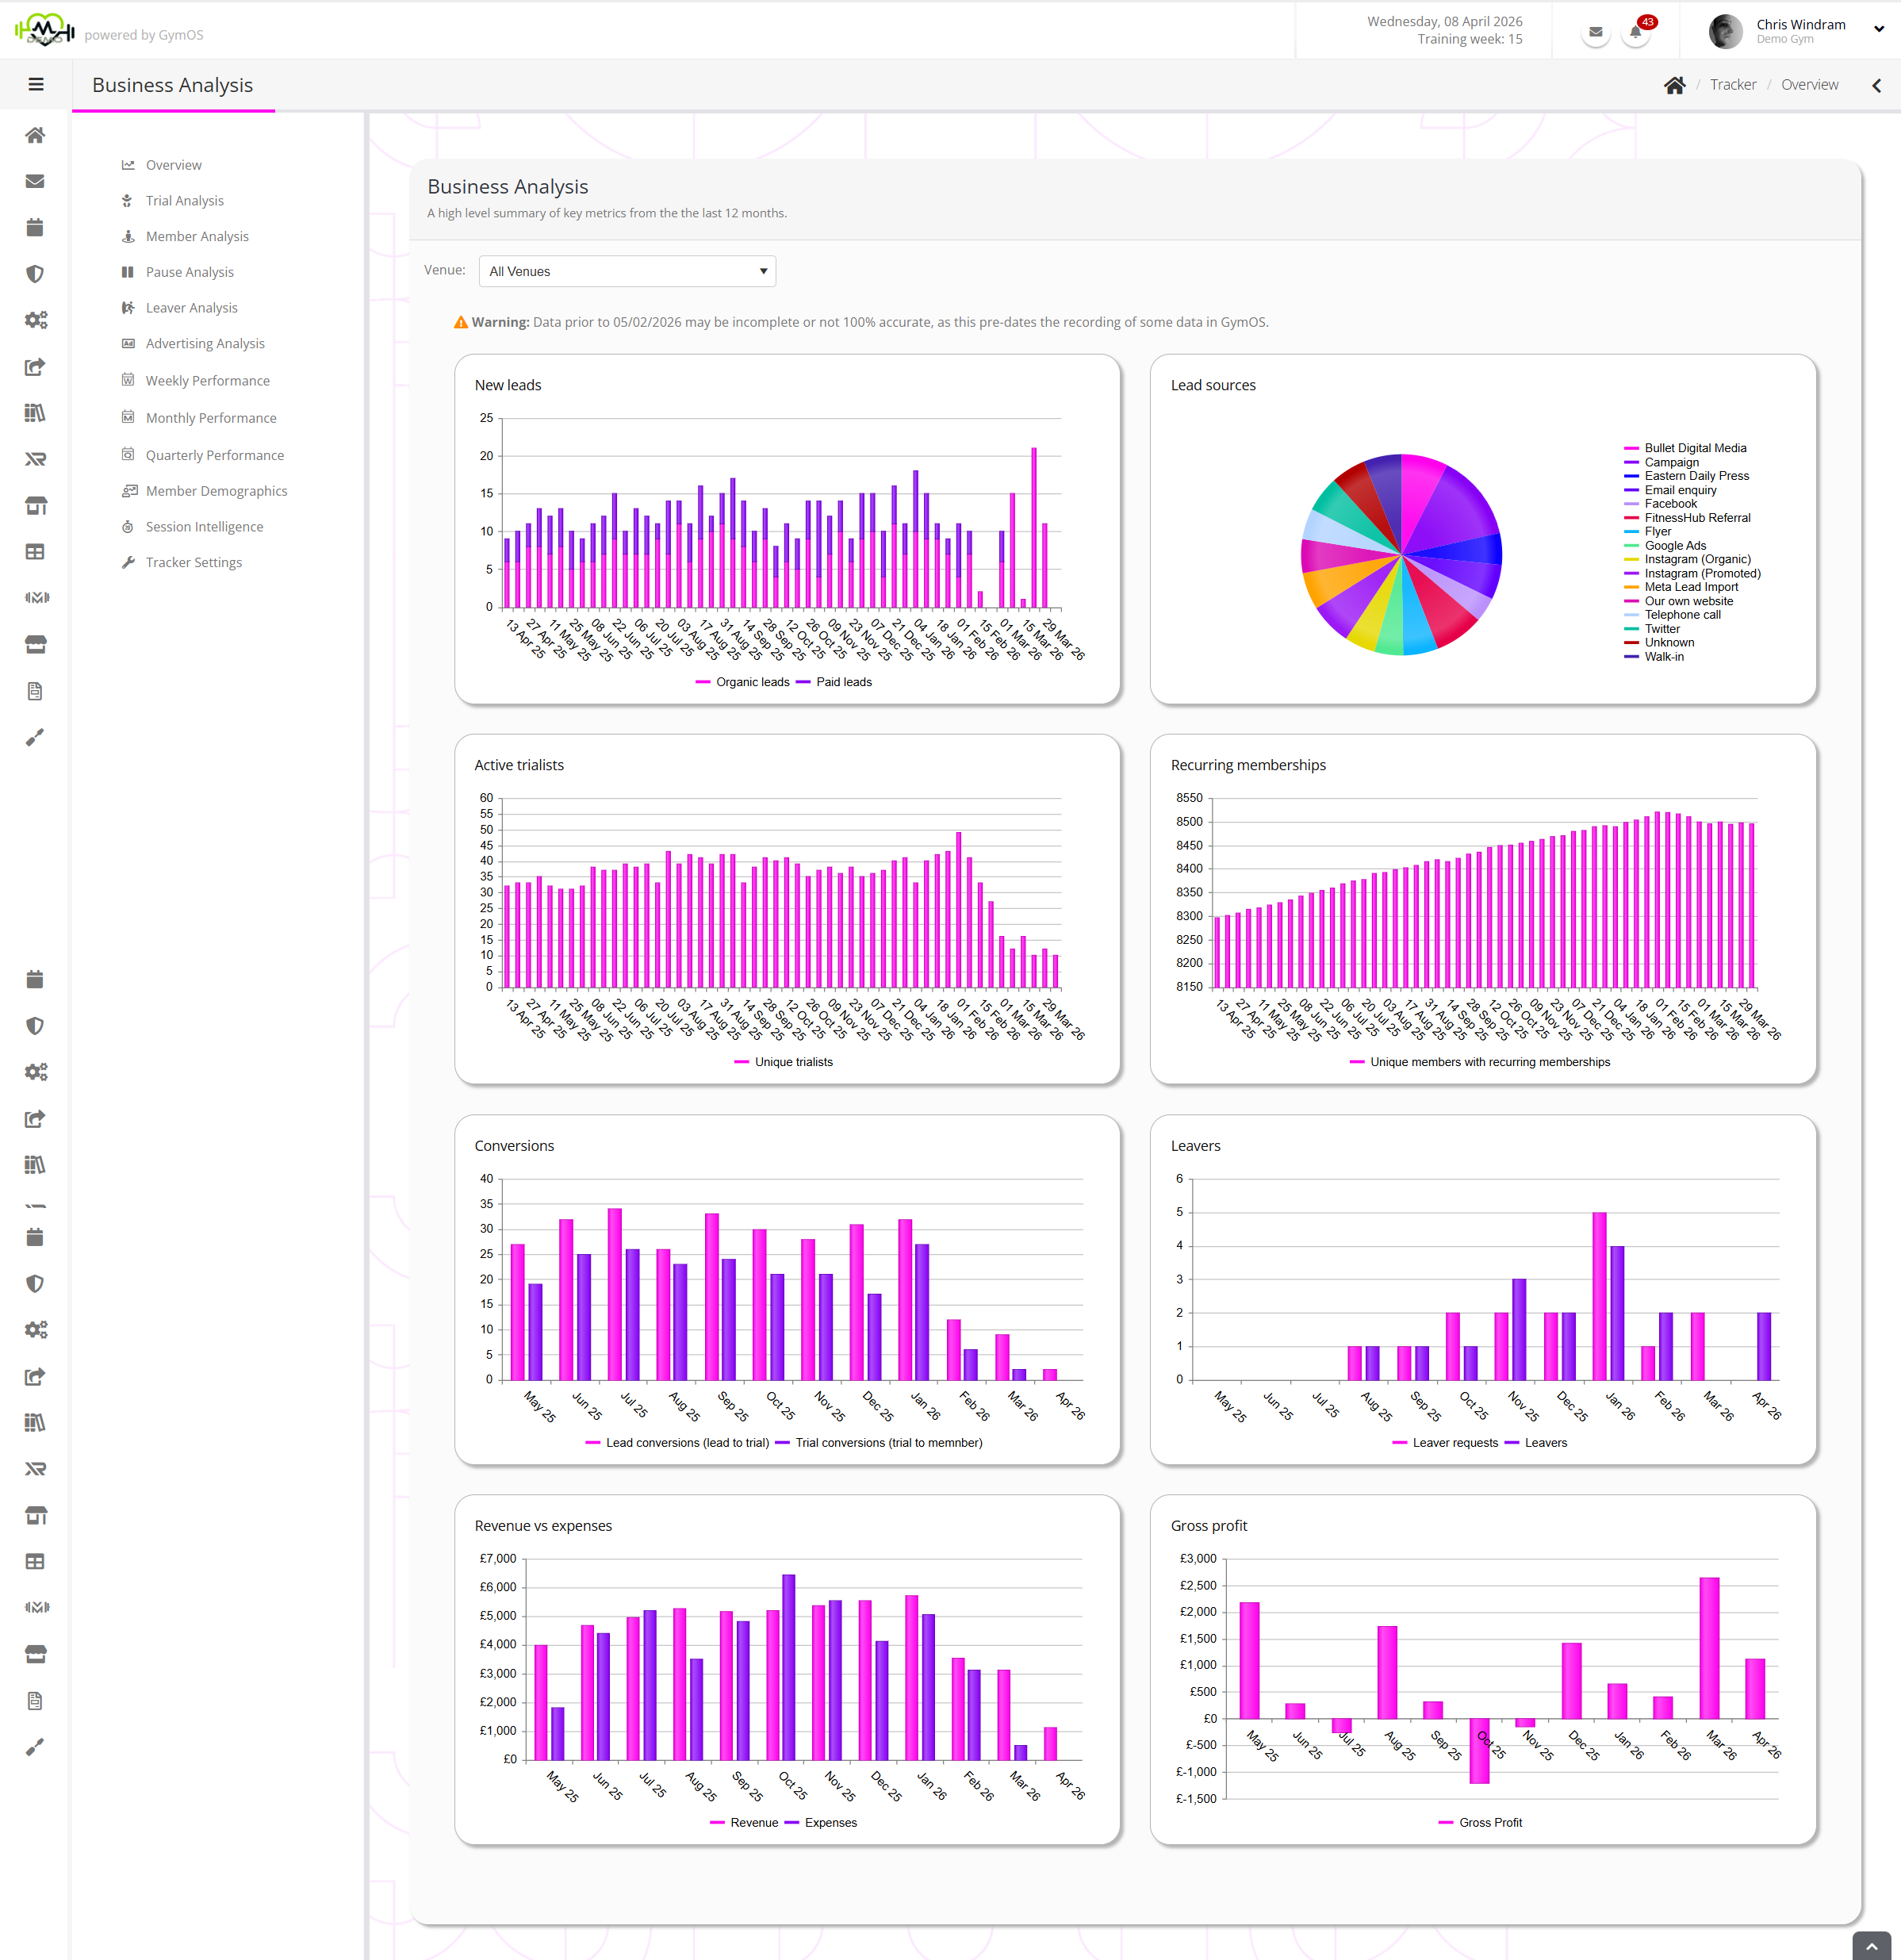
The Overview page displays several graphs focused on the last 12 months. You may also filter by Venue.
- New Leads
Organic leads and paid leads acquired, per week. - Lead Sources
A pie chart showing the allocated source of each lead. - Active Trailists
The number of unique individuals active on a trial membership, per week. - Recurring Memberships
The number of unique members with recurring memberships, per week. - Conversions
Leads converted to a trial, and trialists converted to a recurring membership, per week. - Leavers
Leaver reuqests and leavers, per week. - Revenue vs expenses
Total revenue vs total expenses, per month. - Gross profit
Gross profit (or loss) per month.
Data is refreshed automatically every hour. You may force a refresh by clicking the button next to the corresponding source data in the other tabs within the Business Analysis function.
Metrics prior to 05/02/2026 may be marked with a symbol. This indicates that the data was collected before certain Business Analysis functions were available, and thus may not be 100% accurate.