Business Analysis: Session intelligence
The Session intelligence function is found within the Business Analysis section of Reporting from the main navigational menu.
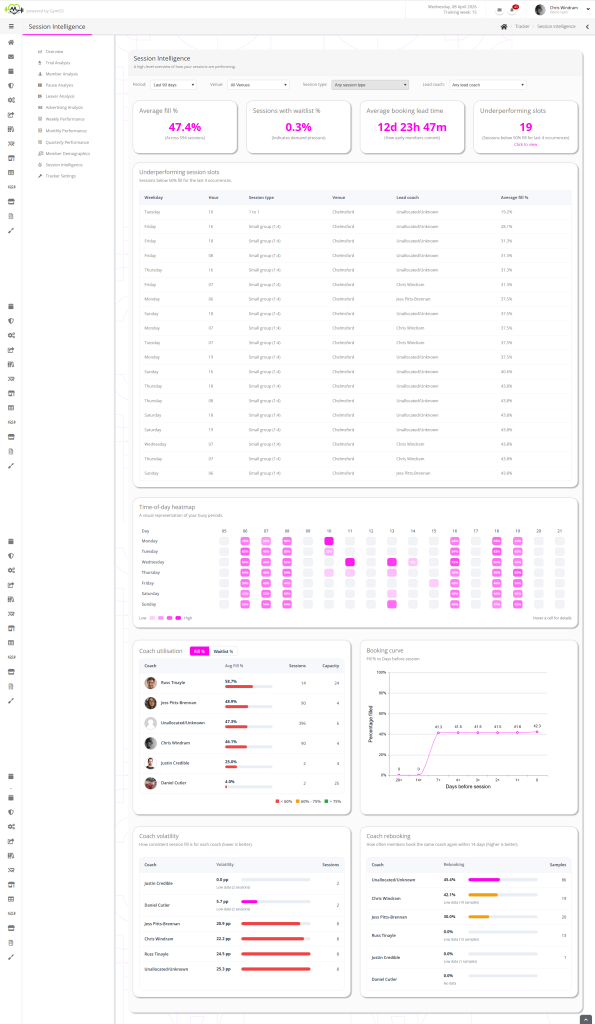
It is possible to filter the session intelligence report by:
- Period (up to 1 year)
- Venue
- Session type
- Lead coach

This dashboard shows you how well your sessions are performing, where demand is strongest, and how your coaches are influencing attendance.
Everything is based on the selected time period (by default, the last 90 days).
Your Executive Snapshot
Average Fill %
What it means:
The average percentage of available spots that are booked across all sessions.
Why it matters:
This tells you how efficiently you’re using your timetable.
How to interpret it:
- 85–95% → Strong utilisation
- 70–85% → Healthy but room to optimise
- Below 70% → Potential over-scheduling
Action idea:
If your average fill is low, consider reducing underperforming slots or adjusting session times.
Sessions With Waitlist %
What it means:
The percentage of sessions that had at least one person on the waitlist.
Why it matters:
Waitlists signal excess demand.
How to interpret it:
- High waitlist % → You may be able to add capacity or increase pricing.
- Low waitlist % → Your schedule may already match demand.
Action idea:
Look at which coaches or times generate waitlists — that’s where expansion makes sense.
Average Booking Lead Time
What it means:
How far in advance members typically book their sessions.
Why it matters:
This shows how predictable your demand is.
How to interpret it:
- Several days in advance → Strong member commitment
- Same-day bookings → More reactive demand
Action idea:
If bookings are mostly last-minute, reminder messaging or booking incentives may help smooth demand.
Underperforming Slots
What it means:
The number of timetable slots that have been below 50% full for their last few occurrences.
Why it matters:
This highlights sessions that may need attention.
Action idea:
Consider:
- Changing the time
- Switching the coach
- Rebranding the session
- Replacing it with a higher-demand format
Coach Performance Rankings
Coach Ranking – Fill %
What it means:
Average percentage of spots filled for each coach’s sessions.
Why it matters:
Shows which coaches drive demand.
How to interpret it:
- High fill rate → Strong draw and popularity
- Lower fill rate → Opportunity for development or schedule adjustment
Coach Ranking – Waitlist Pressure
What it means:
How often a coach’s sessions generate waitlists relative to capacity.
Why it matters:
Identifies coaches who are in excess demand.
Action idea:
Consider:
- Adding extra sessions
- Increasing capacity (if possible)
- Premium pricing
Time-of-Day Heatmap
What it shows:
Which days and times are busiest.
Darker/greener areas mean higher average fill.
Why it matters:
Reveals your true peak hours and quiet periods.
Action idea:
- Expand during peak demand windows.
- Rethink underperforming times.
- Align staffing levels with demand.
Booking Curve
What it shows:
How full sessions typically are at different points before they start (e.g., 7 days out, 1 day out, same day).
Why it matters:
This shows how demand builds over time.
How to interpret it:
- High % 7+ days out → Early commitment culture
- Low early %, high same-day % → Last-minute behaviour
Action idea:
Use marketing nudges when sessions are underfilled at key points (e.g., 48 hours out).
Coach Volatility Score
What it means:
How consistent each coach’s session attendance is.
Low volatility = stable attendance
High volatility = fluctuating attendance
Why it matters:
Consistency makes scheduling safer and revenue more predictable.
Action idea:
Coaches with high volatility may need timetable adjustments or marketing support.
Coach Rebooking Rate
What it means:
The percentage of members who book the same coach again within the next two weeks.
Why it matters:
This measures coach “stickiness” — how well members build loyalty.
How to interpret it:
- High rebooking → Strong relationships and retention
- Lower rebooking → Members may be trying variety or not building attachment
Action idea:
High rebooking coaches are powerful retention drivers. Consider leveraging them for onboarding or premium programmes.
How to Use This Dashboard Strategically
This isn’t just attendance data — it’s a timetable optimisation tool.
Use it to:
- Remove or adjust weak slots
- Expand high-demand sessions
- Reward and support high-performing coaches
- Improve predictability of bookings
- Increase overall session profitability